
Investment thesis
India’s Macro Transition
India’s path to higher incomes requires organized employment, greater productivity and sustained capital investments.
Summary
India’s transition from a low to middle income country will require investment in the core economy that creates mass scale jobs and lifts per capita income. At the same time, global disruption and deglobalization have added urgency to securing key resources and building domestic manufacturing capability. AI and Robotics can accelerate these changes while shifting value towards the physical infrastructure, energy and industrial capacity they depend on.
India’s stage of evolution
India started its Low to Middle Income transition in 2021
India could become a Middle Income Economy in the next 10 to 15 years
Investment led growth enables this transition
Gross investment, % of GDPThe transition window, with GDP per capita in constant 2015 US dollars at each end
In each transition the share of investment in GDP rose and stayed high until incomes had multiplied
World Bank World Development Indicators: gross capital formation as a share of GDP, and GDP per capita in constant 2015 US dollars, fetched 29 September 2026.
Global Playbook for a Low to Middle Income transition
Building a manufacturing ecosystem creates non-farm jobs, which attract rural labour and trigger a virtuous cycle in the economy.
A complex economy with manufacturing and agricultural ecosystems requires goods and people to be moved more efficiently.
An economy in transition needs large amounts of energy and resources, which in turn require large capital investments.
Non-farm jobs draw labour off the land, and the farm sector is left to do more with fewer hands.
Industrial centres need infrastructure, which creates construction jobs and urbanization, and an ecosystem in which to build a new life.
As farm labour leaves, agriculture modernizes and mechanizes, and rising affluence requires supply chains for perishables to upgrade.
Core Economy Investments›Mass Scale Jobs›GDP per Capita Growth
Applying the Playbook to India’s current stage of evolution
- Agriculture46.1%
- Services29.7%
- Manufacturing11.4%
- Construction12.0%
- Power and mining0.7%
- Agriculture17.7%
- Services54.2%
- Manufacturing14.3%
- Construction9.0%
- Power and mining4.8%
Manufacturing has a very low absolute share of GDP. Growing manufacturing contribution will enhance overall productivity.
Power and Mining are key inputs for the manufacturing ecosystem and will grow correspondingly.
Agriculture will modernize and mechanize as farm labour reduces and improve productivity ratios.
Share of employment and of gross value added by sector.
Potential Path Ahead, based on Current Stage of Evolution
Incentivize the growth of manufacturing
Manufacturing has a very low absolute share of GDP. Growing its contribution will enhance overall productivity.
- Large imports currently
- Strategic importance
- Competitive advantage
Local manufacturing catalyzes many sectors
Power and mining are key inputs for the manufacturing ecosystem. Construction will be driven by Industrialization and Urbanization.
- Power and mining
- Construction and real estate
- Infrastructure and logistics
Enhance productivity in agriculture
Agriculture will modernize and mechanize as farm labour reduces, and its productivity ratios will improve.
- Farm to fork linkages
- Manufacturing of fertilizers
- Agricultural and food exports
Global Macro Scenario
The post-Covid macro landscape, the forces behind it, and what they mean for India.
Post Covid Macro Landscape
- 2020
Covid
- Fragility of offshore supply chains
- Re-shoring and domestic production
- Governments making capital allocation decisions
- 2022
Russia and Ukraine
- Urgency on energy and resource security
- Questions on the US dollar as a reserve asset
- Altered the dynamics of warfare
- 2025
Tariffs
- Accelerated onshoring and friend-shoring
- Deglobalization and national capitalism
- No recycling of FX surpluses into US bonds
- 2026
Middle East conflict
- Disrupts trade and energy routes
- Supply chain resilience a necessity
- Asymmetric warfare costly for superpowers
Making sense of the Macro Scenario
Three defining factors of the current Macro regime
G7 debt overhang
252%total debt to GDP, advanced economies, Q1 2026
Financial repression becomes more likely as debt burdens rise, creating a need for growth and some sticky inflation.
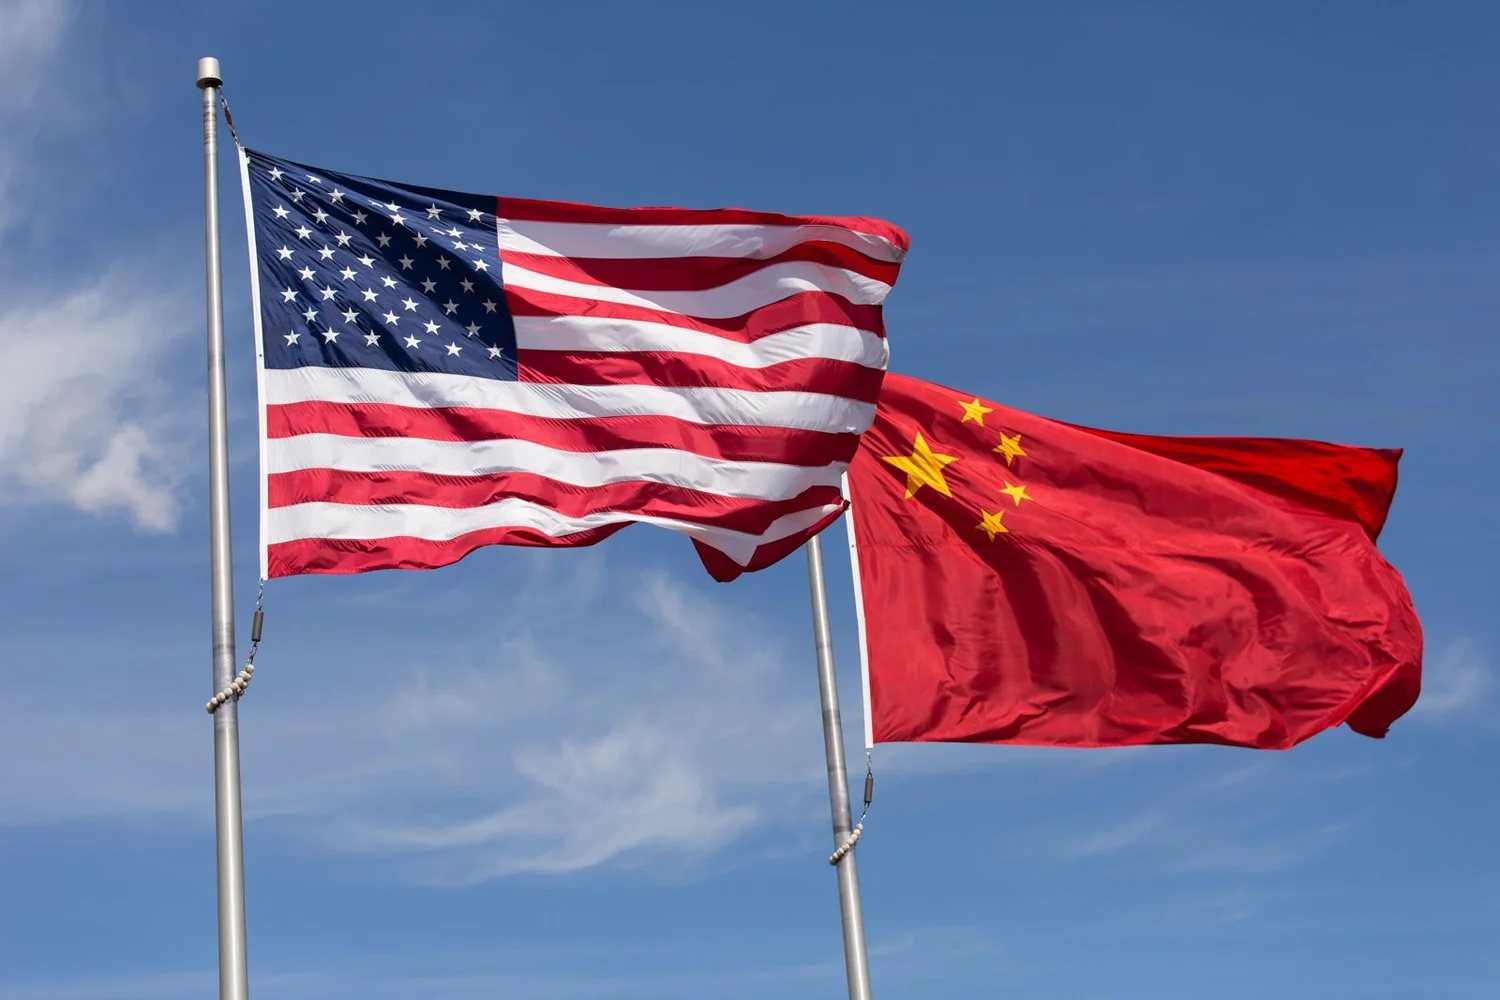
Superpower Battle
19% v 15%China and the United States, share of world GDP at PPP, 2024
Competition spans technology, trade, capital, currency and military domains.
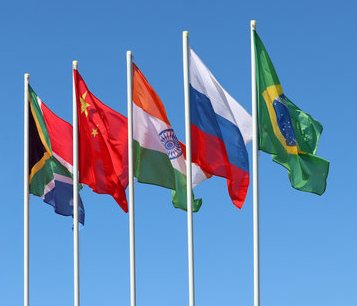
Emerging Markets Growth
60%emerging and developing economies, share of world GDP at PPP, 2024
BRICS and other emerging economies are gaining weight in trade, capital and geopolitics.

Rising G7 debt creates the need for financial repression
BIS, total credit to the non-financial sector, % of GDP, Q1 2026.
Superpower Battle: competition across domains
Military
Rising tensions and flash points shape global security and strategic calculations.
- War economics

Governments take a greater role in capital allocation. Disrupts classical capitalism.
Technology
Export bans and strategic competition are reshaping global innovation and supply chains.
- Semiconductors
- AI race
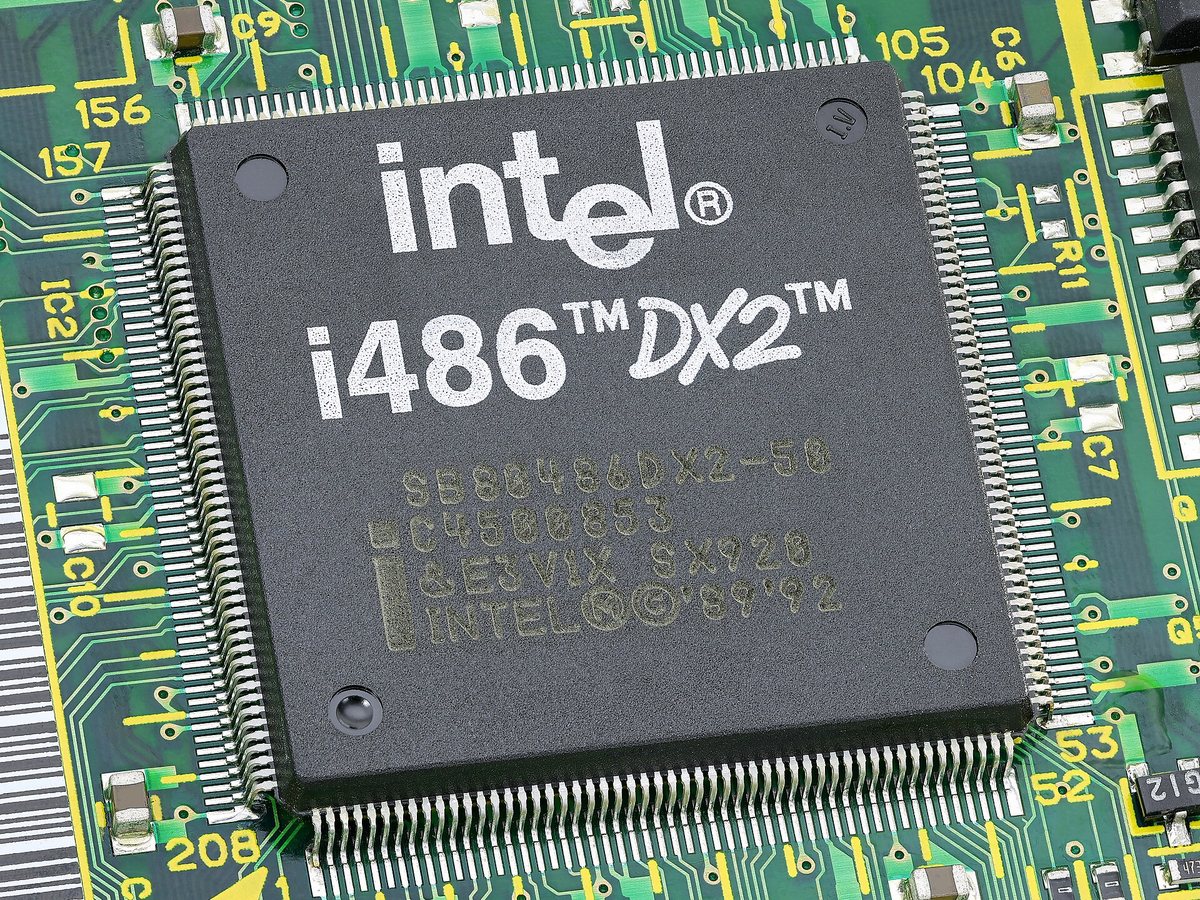
Critical technologies are withheld by nations. Disrupts globalization.
Economic
Trade wars and retaliatory measures are restructuring global trade and capital flows.
- Tariffs
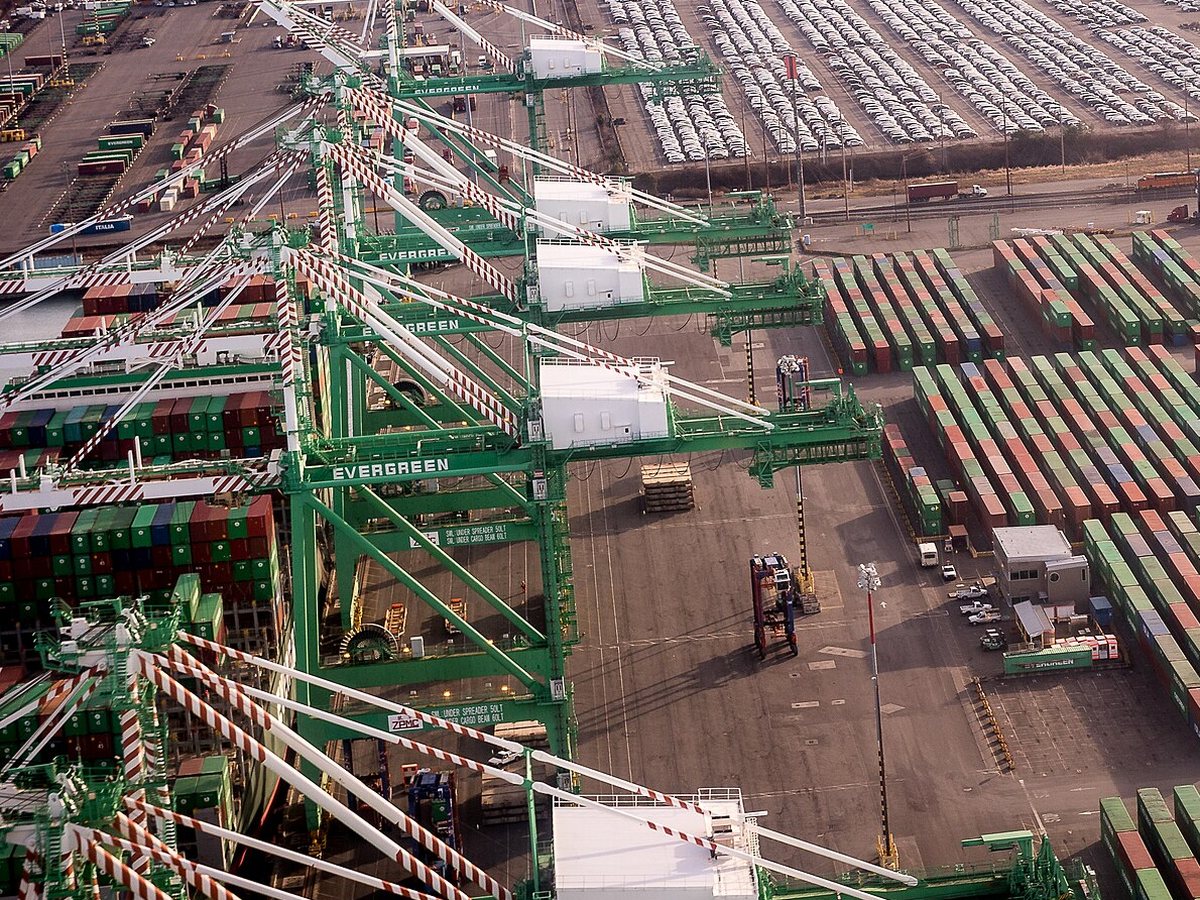
Tariffs become a tool of national capitalism. Disrupts the global economic order.
Energy & Resources
Competition for securing energy and materials.
- Supply chains
Conflicts over resources and hoarding of supplies. Disrupts energy and materials supply.
Rise of Emerging Markets: weight in output, not yet in money
- 60%
- Share of world GDP at PPP Emerging and developing economies, 2024
- 89%
- FX trades involving the US dollar Many EM trades settle through NDFs, not local currency
The dollar as a reserve asset?
Central banks are buying other assets. They added over 1,000 tonnes of gold in each of 2022, 2023 and 2024.
The dollar as a reserve currency?
If the United States launches dollar stablecoins, the emerging markets may answer with a BRICS unit and central bank digital currencies.
IMF World Economic Outlook, PPPSH, 2024; BIS Triennial Survey, April 2025; World Gold Council, Gold Demand Trends 2024.
Challenges for India
Import dependence
Energy security
Energy security and building a local manufacturing ecosystem are key to tackling India's import bill.
Technology
Import dependence extends beyond products to the underlying technology, components and intellectual property.
Critical Minerals & Fertilizers
The fertilizer import bill is an area of growing concern, because of repeated supply chain issues.
Share of India’s import bill by category.
Export concentration
US is the biggest export destination. FTAs with EU, UK and UAE offer ability to de-risk
Goods: Ministry of Commerce and Industry, DGCI&S, FY2024-25, the EU as one market (EU-27). Services: OECD-WTO Balanced Trade in Services (BaTIS) 2024 partner shares, applied to RBI’s FY2024-25 services exports of $387 bn; India publishes no country split. Shares of total exports of $825 bn, rounded.
Potential Path Ahead, based on the Global Macro Scenario
Tariffs can widen current account deficits
Policy turns to import substitution, energy security and resource nationalism.
- Import substitution
- Energy security
- Resource nationalism
Preparing for a split in the monetary system
Policy turns to alternate reserve assets, trade using CBDCs, and preparing for conflicts.
- Alternate reserve assets
- Trade using CBDCs
- Prepare for conflicts
Global competition for FDI and FPI flows
In such a world, most countries would like to retain their capital. Manufacturing strength, deep bond markets and technological progress attract it.
- Manufacturing strength
- Depth of bond markets
- Technological progress
Technology and the physical world
Abundance versus scarcity, wartime as accelerant, the human element.
Exponential spread of knowledge as AI breaches the barrier to intelligence
- 98%
- Fall in the cost of intelligence GPT-4-class output: $30 to under $0.50 per million tokens
- 330x
- Growth in tokens processed monthly Change over the past two years
- Intelligence spawns intelligence as AI creates and upgrades itself.
- Technology is not constrained by a shortage of technicians or ecosystems.
- Gen AI simplifies man-machine interface, opens doors for rapid adoption
Areas priced on the scarcity of knowledge face competition
Stanford AI Index 2025, Google I/O 2026, Bloomberg. Revenue figures are press-reported run rates.
Constraints to this exponential growth lie in the physical world
- 4 to 10 years
- Waiting period for a grid connection The data centre itself takes 2 to 3 years
- Over 2x
- Increase in equipment lead times Transformers, chillers and switchgear
- $6.7 trillion
- Data centre capex needed by 2030 Power demand to grow 165% by 2030
Incumbents owning key assets become more productive
Stanford AI Index 2025, Google I/O 2026, Bloomberg. Revenue figures are press-reported run rates.
Wars have historically catalysed rapid technological progress
Wartime compresses decades of incentives, capital, engineering, approvals and production into a few years.
Potential Path Ahead, for Technology and Human Capital
Abundant Intelligence can build R&D Ecosystem
Areas priced on the scarcity of knowledge, such as software and commoditized services, face competition. Areas that struggled to attract intelligence, such as deep tech and research, can benefit.
Physical bottlenecks are attractive investments
Policy acts to reduce vulnerabilities in power, minerals and industrial capacity. Incumbents owning irreplaceable hard assets and scarce physical-world data become more productive.
Formalizing India’s workforce
90% of workers are in informal jobs: agriculture, construction, retail, manufacturing, healthcare, artisans and drivers. AI can bring them into the mainstream with skills, jobs, benefits, healthcare, trust, work history and contracts.
Views and scenarios are the firm’s as at September 2026 and may change. General macro and sector commentary, not a recommendation to buy or sell any security. Investment objectives and capital preservation are not assured.